Saturday, December 8, 2007

The Story of Stuff

Couple of days back, a professor in my department forwarded me the link of this movie, saying it is 20 min long but worth seeing. After seeing I realized that this was the best animation I have ever seen.

Click on the image or here to see movie. I don't want to spoil surprise by writing more about movie but if you trust my words, you are guaranteed your time will not be wasted.

Thursday, November 29, 2007

Inter-relationship between the chemistry of aerosols and precipitation and their implications

The large-scale anthropogenic emissions have been increasingly affecting the air quality as well as regional and global climate by altering Earth’s surface temperature and precipitation patterns. These pollutants are removed from the atmosphere via wet and dry deposition, which in turn may adversely affect the terrestrial and aquatic environments, ranging from acidification of soils and inland waters to the damage of buildings and monuments. The regional precipitation chemistry provides the simplest way to assess the influence of human activities on the composition of the atmosphere, and to improve knowledge of physico-chemical processes related to the atmospheric transport and deposition of pollutants. The chemical composition of an individual precipitation event is dictated by ‘in-cloud’ and ‘below-cloud’ scavenging of atmospheric aerosols and gaseous species derived from natural and anthropogenic sources. Wet and dry deposition also provides information on the exchange of chemical components between the atmosphere and the land/ocean and hence it is an important link in understanding the biogeochemical cycles of important chemical elements such as N, P and S.

Rastogi and Sarin (2007) have discussed the inter-relationship between aerosol and rain composition collected over a period of three years at Ahmedabad, an urban city located in a semi-arid region of India. They have proposed a simple way (comparison of ionic ratios in aerosol and rain) to understand the dominant scavenging processes (in-cloud/below-cloud) of chemical species and the phase (gaseous vis-à-vis particulate) from which it is scavenged by rain. By first direct measurement of alkalinity in rainwater over India, they have discussed the reason of alkaline rain over their study region, in spite of high concentrations of acidic pollutants like SO4 and NO3.

For more details, please read the following article and references therein:

Rastogi, N. and Sarin, M.M., 2007. Chemistry of precipitation events and inter-relationship with ambient aerosols over a semi-arid region in western India. Journal of Atmospheric Chemistry 56, 149-163. (DOI 10.1007/s10874-006-9047-5).

Sunday, November 4, 2007

Dust Aerosol: Spherical Vs Non-Spherical

In most climate and radiative transfer models, optical properties of aerosols are modeled using spherical shape assumptions. This assumption is based on sound scientific reasoning. All liquid aerosols have spherical shape because of surface tension. Solid aerosols, which are water soluble also eventually absorbs water vapor from atmosphere and transform themselves into spherical shape.

However, dust aerosols are neither liquid nor water soluble. Soot aerosols also fall in this category. Hence, they may not necessarily have spherical shape. This requires that we should examine the validity of spherical shape assumption, particularly for these two types of aerosols. There are two aspects to look at for importance of spherical shape assumption. One is relative magnitude of non-spherical aerosol number concentration. If there are not quite large number of non-spherical particles in the atmosphere, then we need not worry about it. Li and Osada (2007) have shown using model study that dust particles are essentially spherical when away from source regions, this is due to preferential settling of non-spherical dust particles. (See our earlier blog). This kind of studies are relatively few and recent. We can expect to see in future their modeling results being compared with observations of Saharan dust transport over Atlantic ocean.

Second aspect is effect of non-sphericity on optical properties. It is believed that when non-spherical particle are randomly oriented, their overall impact can be modeled by assuming them spherical with some kind of equivalent effective radius. Though this assumption appears correct intuitively, not extensively validated. Recently, I come across an article by Yang et al. (2007), who have compared optical properties of aerosols for spherical and non-spherical (spheroid) shape assumptions. They have shown that the non-sphericity has negligible impact on optical properties in long-wave (terrestrial) spectrum. However quite a large effect can be seen in short wave (solar) spectrum.

Figure (12) of Yang et al. (2007) show the effect of spherical and spheroidal shape assumption on estimates of brightness temperature and top of the atmosphere reflectivity. The black curves represent clear sky condition, blue curves dust particle with spherical shape and red curves represent dust particle of spheroid shape (aspect ratio 1.7). When used spheroidal shape assumption to calculate top of the atmosphere reflectance, quite a large difference can be seen in shortwave (~30% difference at 500 nm)

References

  1. Li, J. and K. Osada (2007, September). Preferential settling of elongated mineral dust particles in the atmosphere. Geophysical Research Letters 34, L17807+.
  2. Yang, P., Q. Feng, G. Hong, G. W. Kattawar, W. J. Wiscombe, M. I. Mishchenko, O. Dubovik, I. Laszlo, and I. N. Sokolik (2007, October). Modeling of the scattering and radiative properties of nonspherical dust-like aerosols. Journal of Aerosol Science 38 (10), 995-1014.

Conferences in the field of aerosol, cloud and climate

Recently I received quite a good number of conference related notifications. Many of reader of this blog may be participating it and they shouldn't miss the dead-line so I am listing them below. If you know conference that is not listed below but related to theme of this blog please let us know.

15th National Space Science Symposium, India (NSSS-2008)

National Space Science Symposium is one the largest gathering of space scientist in India. It covers wide variety of subjects including remote sensing of atmosphere and climate change study. The next NSSS is going to be held at Radio Astronomy Centre (NCRA-TIFR) in Ooty between 26 and 29 February 2008. Ooty is one of the famous hill-station in India.

Last date to submit abstract Dec 7, 2007.


Broad subject areas covered in this conference

  • Space- and ground-based astronomy and astrophysics, planetary science / exploration
  • Solar radiation and its interaction with earth's near and distant environment
  • Magnetosphere, ionosphere, thermosphere, and middle atmosphere phenomena
  • Space based oceanography, meteorology, and tropospheric studies
  • Climate changes and geosphere-biosphere interaction processes


EGU General Assembly 2008
European Geophysical Union's general assembly will be held in Vienna, Austria between 13 and 18 April 2008.
Last date to submit abstract: January 14, 2008
Last date to submit financial support application: December, 7, 2007
Last date for registration: March 31, 2008
Subject area covered are
It covers all disciplines of Earth, Planetary and Space Sciences

AOGS 2008
Asia Oceania Geosciences Society's (AOGS) 5th annual meeting will be convened between 16 and 20 June, 2008 in Busan, Korea.
Abstract submission dead-line: Jan 24, 2008
Author registration dead-line: Apr 22, 2008
This also covers all the subjects in Geoscience area.

International Conference on "Terrestrial Planets: Evolution through Time"

This conference will be held between 22 and 25 Jan 2008 in Physical Research Laboratory, Ahmedabad, India. Last date for abstract submission is November 15, 2007.

Following are the main theme of conference
  • Early solar system and Planetary processes
  • Evolution of the Indian Plate: Precambrian to Recent
  • Paleoclimate and Paleoenvironment
  • Tectonics-Erosion-Climate and Carbon cycle

Acknowledgment
Images used here are taken from the web-pages of those conferences.

Tuesday, October 23, 2007

BIOAEROSOLS

Indoor or outdoor air may contain thousands or even millions of microorganisms and biological particles in just one cubic meter of air. These airborne particles are collectively referred to as bioaerosols. Examples of bioaerosols include viruses, bacteria, fungi, pollen, fragmented particles from microbial cells or insects, and by-products of living organisms (e.g. animal dander, insect excrement). The size of these particles generally varies between a fraction of a micrometer (µm) to approximately 30 µm. Bioaerosols may originate from numerous natural or man-made sources such as agriculture (harvesting, storage, composting etc) and industrial activities (manufacturing, food processing etc), indoor surfaces (ceiling, wall, carpets, house plants) and water treatment plants etc.
Particle size is an important factor in determining risks associated with microbial contamination. In general, particles > 20 µm (fungi, algae, pollen etc) affect Region 1, Particles < 20 µm (mostly bacteria and some fungi, algae) affect Region 2 and particles < 1or 2 µm (mostly viruses and some bacteria) affect Region 3.


Modern airborne sampling of bioaerosols employs one of three protocols: 1) impactor sampling, 2) liquid impinger sampling, or 3) filtration sampling. Each of these methods pulls a measured volume of air with the aid of an electric or battery-powered pump. The air is then directed through a chamber (or a series of chambers), guiding the spores (particles) on a specific trajectory to a solid agar disc or adhesive medium (impactor samplers), a liquid buffer (impinger samplers), or a filter (filtration samplers). With the impactor method, cells or spores are usually cultured on a suitable nutrient medium. Each organism is then identified and reported as colony forming units m-3 (CFUs per cubic meter).
Since state and federal standards for most of the bioaerosols do not exist, the most common practice compares indoor cell concentrations to concentrations measured outdoors during the same sampling event. This unofficial benchmark implies that indoor counts should not be significantly greater than outdoor counts. When indoor concentrations are significantly greater, it is generally assumed that an indoor amplification source exists. In other words, there is likely microbial contamination present on indoor building materials. Such basic approaches do not apply to all microorganisms. Relatively high levels of one airborne microbe may represent very low risks, while extremely low levels of more dangerous contaminants should trigger immediate action. Other important factors must also be considered, including the location of air samples, frequency of detection, frequency of sampling, type of air sampler, and the environmental conditions while assessing the effects of bioaerosols.
For more information and understanding, please refer the following book and other literature

Macher, Janet (Ed.), Bioaerosols: Assessment and Control, American Conference of Governmental Industrial Hygienists, Cincinnati, Ohio, 1999.
ISBN: 978-1-882417-29-2

Monday, October 15, 2007

Conference & Symposiums on Environment Science: AGU and AMS 2007-2008

Annual fall meeting of American Geophysical Union (AGU) and annual meeting of American Meteorological Society (AMS) is approaching close in December 2007 and January 2008 respectively. These are two biggest events in USA where more than 20 thousands scientist from around the world get together to discuss, show and present their research in various areas of Earth Sciences. Environment science is one of the main focus area in both meetings and several thousands research studies on the same will be presented.

The next AMS (88th Annual Meeting) will be held in, New Orleans, LA, USA during 20-24 January 2008.


Please click on the link to see various topics covered by AMS-2008

http://www.ametsoc.org/meet/annual/programsandevents.html

and

This year AGU Fall meeting will be held in San Francisco, CA, USA during 10–14 December 2007.

For more details click here

http://www.agu.org/meetings/fm07/

Friday, October 12, 2007

IPCC gets Nobel Peace Prize

The Norwegian Nobel Committee has decided that the Nobel Peace Prize for 2007 is to be shared, in two equal parts, between the Intergovernmental Panel on Climate Change (IPCC) and Albert Arnold (Al) Gore Jr. for their efforts to build up and disseminate greater knowledge about man-made climate change, and to lay the foundations for the measures that are needed to counteract such change.

Indications of changes in the earth’s future climate must be treated with the utmost seriousness, and with the precautionary principle uppermost in our minds. Extensive climate changes may alter and threaten the living conditions of much of mankind. They may induce large-scale migration and lead to greater competition for the earth’s resources. Such changes will place particularly heavy burdens on the world’s most vulnerable countries. There may be increased danger of violent conflicts and wars, within and between states.

Through the scientific reports it has issued over the past two decades, the IPCC has created an ever-broader informed consensus about the connection between human activities and global warming. Thousands of scientists and officials from over one hundred countries have collaborated to achieve greater certainty as to the scale of the warming. Whereas in the 1980s global warming seemed to be merely an interesting hypothesis, the 1990s produced firmer evidence in its support. In the last few years, the connections have become even clearer and the consequences still more apparent.

Al Gore has for a long time been one of the world’s leading environmentalist politicians. He became aware at an early stage of the climatic challenges the world is facing. His strong commitment, reflected in political activity, lectures, films and books, has strengthened the struggle against climate change. He is probably the single individual who has done most to create greater worldwide understanding of the measures that need to be adopted.

By awarding the Nobel Peace Prize for 2007 to the IPCC and Al Gore, the Nobel Committee is seeking to contribute to a sharper focus on the processes and decisions that appear to be necessary to protect the world’s future climate, and thereby to reduce the threat to the security of mankind. Action is necessary now, before climate change moves beyond man’s control.

Sunday, September 30, 2007

Causes of the reduction in uncertainty in the anthropogenic radiative forcing of climate betweeen IPCC (2001) and IPCC (2007)

The Inter-governmental Panel on Climate Change reviews the best available scientific information on climate change and publishes a report every 5-6 years. The fourth assesment report was released this year and is the IPCC 2007 report. In contrast to the IPCC 2001 report, this report emphasizes with greater confidence that global warming is due to human/anthropogenic activities. Until recently, the sign of the anthropogenic radiative forcing was uncertain largely due to the uncertainty associated with radiative effects (direct and indirect) of atmospheric aerosols. Haywood and Schulz in their recent paper (titled above) inter-compare the probability distribution function of anthropogenic radiative forcing from IPCC 2001 and IPCC 2007 and show that a significant progress has been made in reducing the uncertainty in anthropogenic radiative forcing since IPCC 2001. They conclude that " the single most contributor to this conclusion appears to be the reduction in the uncertainty associated with the aerosol direct effect, followed by the provision of a best estimate for the aerosol cloud albedo indirect effect ".


References :

Haywood, J. M., and M. Schulz (2007), Causes of the reduction in uncertainty in the anthropogenic radiative forcing of climate between IPCC (2001) and IPCC (2007), Geophys. Res. Lett., doi:10.1029/2007GL030749, in press.


Sunday, September 23, 2007

UN/Austria/ESA Symposium on “Space Tools and Solutions for Monitoring the Atmosphere in Support of Sustainable Development”: My Experience

The United Nations (UN) office for outer space affairs, the government of Austria and the European Space Agency (ESA) jointly organized a symposia on “space tools and solution for monitoring the atmosphere in support of sustainable development”. The United Nations invites participants from several nations to attend the symposium every year. There were more than 70 scientists representing more than 41 countries who gathered in Graz, Austria during September 11-14 to discuss various available space tools for monitoring the atmosphere in support of sustainable development. This year’s symposium included a hands-on tutorial and interactive training session on “Satellite Tools and Applications for Air Quality”. I was part of the team, which developed material and conducted the training session. I would really like to take this opportunity to thank my supervisor Dr. Sundar Christopher for providing me this wonderful opportunity and NASA’s applied science program manager Lawrence Friedl for financial support and organizers of the symposium for giving me this amazing opportunity to attend the symposium. It was indeed a great experience to meet and listen to many scientists from different parts of the world on many different aspects of air quality and monitoring atmospheric composition using satellite measurements.


The symposium was a good combination of invited talks, participant presentations and hands-on training workshop. Invited talks covered several important areas including overview of earth observations, satellite applications for atmospheric monitoring, global and regional initiatives, air quality (ozone and particulate matter), climate change and weather.


Hands-on training on satellite tools for air quality monitoring was informative and every single participant experienced handing of satellite data and I am very sure they enjoyed it immensely. The training used four different case studies of heavy aerosol events when particulate matter air quality on the surface was very poor in the region. Case studies covered two recent biomass burning events, one dust storm and one with a mixture of urban pollution and smoke from fires. The participants from the symposium were divided into groups of 3-4 people and each group was provided with a laptop computer. After initial introduction on monitoring air pollution from satellite observations, each group analyzed one case study. Air quality analysis includes identifying different features such as aerosols, clouds, water, land etc in the satellite images, quantifying aerosol loading using aerosol optical thickness, observations on local meteorological conditions and back trajectory analysis to track air mass in and out from the regions of interest. One of the most important parts of this exercise was to obtain different data sets and images from freely available online resources. Every group liked this part and learnt simple solutions to address specific air quality events using satellite imagery. Finally, participants used the tools that they learnt in the workshop to identify air quality color codes in their city or region of interest.


I really enjoyed the entire training session and discussed many different issued related to air quality in different parts of the world. The last day of the symposium was used to identify different problem associated with air quality research and monitoring of air pollution in the participant's country or region. There were several recommendations made by two working groups on air quality monitoring network, data sharing, and policy related issues to the United Nations.

Evening receptions and tours within Graz city were wonderful and served as a time of relaxation after the busy working days for all participants.

Finally, I would like to congratulate and thank all the people who were directly or indirectly involved in organizing such a great successful symposium.

More details about the symposium can be found out on following web link
http://www.unoosa.org/oosa/SAP/act2007/graz/index.html

(Pawan Gupta)
The University of Alabama in Huntsville
Huntsville, AL, USA

P.S: The participants were eager to know the various resources that are available to them on the internet for various data sources. Here are a list if some websites that will be useful.

GIOVANNI: MODIS, MISR, TOMS, OMI aerosol daily and monthly data can be obtained and visualize online using various options available.

MODIS Atmosphere: Details description on MODIS atmospheric products such as aerosols, clouds, water vapor and atmospheric profiles. This is very good site to learn about data, algorithms and updates on publications.

MODIS Rapid Response System: True-color, photo-like imagery and false-color imagery are available within a few hours of being collected by MODIS.

NASA Visible Earth: This is good catalog for different Earth’s images from NASA.

International Air Quality: This site is hosted on USEPA webpage, which provides link to available online resources for international air quality monitoring.

IDEA: This site provides surface and satellite assessment of particulate matter air quality over United States.

NRL Aerosol Page: This site provides model forecasts of various aerosol fields for global regions. This site also maintain very good list of links related to atmospheric aerosol research.

Monday, September 17, 2007

History of Aerosol Science


The first time my interest in aerosol science picked up was when I learnt about nuclear winter -- a phenomena which refers to possible climatic impact of all-out nuclear war. What really fascinated me was the idea that if one wants to control climate or weather in predictive manner, aerosols are going to be the best tool; for a reason that they have relatively short life-time giving control over their introduction and removal in the atmosphere. Well! this is not the subject of today's post. Thinking of my own interests in this field led me to think about history of aerosol science. Couple of years before I read Spencer Weart's "The Discovery of Global Warming". I am fascinated by its content and writing style. Experience was not less than reading suspense thriller. Later on, I come across a comment that book is weighted toward contributions of American scientists than European scientists. I do not know the truth as my knowledge in the history of climate science is limited. But if asked Weart's book is my first recommendation.

The climate scientist J. Murray Mitchell, Jr. took up the question, with the help of improved data on how minuscule particles (aerosols) moved through the upper atmosphere. Studies of fallout from nuclear bomb tests had shown that fine dust injected into the stratosphere would linger for a few years, but would not cross from one hemisphere to the other. With that in mind, Mitchell pored over global temperature statistics and put them alongside the record of volcanic eruptions. In 1961, he announced that large eruptions caused a significant part of the irregular variations in average annual temperature in a given hemisphere. On the other hand, average temperatures had fallen since 1940, a period in which the world had seen few major eruptions. Mitchell concluded that the recent cooling was an "enigma." He thought it might signal a new phase of a decades-long "rhythm," the sort of cycle that generations of climatologists had tried to winkle out of their data
While thinking of Weart's book, I started searching what resources are available on Internet about history of aerosol science and to my delight I found that Weart has created web-pages to supplement his book. On his web-page you can read history of aerosol science and global warming with full references, illustrations and pictures of scientists. A link is available to download whole web-site in zip file so one can burn his/her own CD, or one can download PDF file and print it and of cause one can read it online. Following is the link to table of content.

Climate Change: Discovery of Global Warming
http://aip.org/history/climate/

Thursday, September 6, 2007

Treating Dust As A Spherical Particle: Good/Bad Assumption?

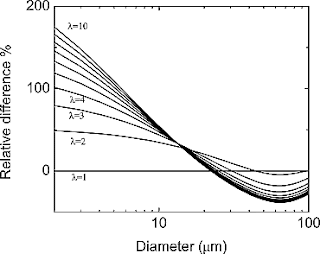
It is widely know that dust is essentially non-spherical and hence radiative transfer calculations treating dust as a spherical particle are not adequate. A recent laboratory based study on dust particles by Jingmin Li and Kazuo Osada is very interesting. This article appeared in GRL this month. They study the preferential setting of elongated mineral dust collected from snow in a high mountain in Japan. The positions of particles' centers of gravity and folding centers are analyzed using a scanning electron microscopy and optical microscopy. Their results suggest that a preferential orientation exists for particles settling heavy side down (as expected) but what is interesting is the analysis of results from Ginoux's model wherein they apply this preferential orientation information and show that : " away from the source regions, dust particles are essentially spherical, which considerably simplify the calculation of settling velocity in transport and of radiative transfer models."

Figure above shows the relative difference of calculated settling velocity between ellipsoidal and spherical particles {Δu∞ = 100% × [u∞ (λ) − u∞ (λ = 1)]/u∞ (λ = 1)}. For example, the settling velocity of particles of 2 μm diameter increases respectively around 50%, 100%, and 165% for aspect ratios of 2, 4, and 10. The relative difference decreases with increasing particle size. For particles of 10 μm, the settling velocity increase for ellipsoids is around 30–40%, with little difference shown for aspect ratios of 1–10. On the other hand, a 40% decrease of settling velocity for ellipsoids is apparent at around 40–50 μm for the aspect ratio of 10.


Reference :

Li, J., and K. Osada (2007), Preferential settling of elongated mineral dust particles in the atmosphere, Geophys. Res. Lett., 34, L17807, doi:10.1029/2007GL030262.

Tuesday, August 28, 2007

Aerosols heat up

Aerosols are thought to have a cooling effect on the atmosphere, and therefore to have mitigated some of the expected global warming over this period. This is, however, a highly uncertain conclusion, in part because the total amount and vertical distribution of solar radiation that is absorbed by aerosol particles is imperfectly known. There was an interesting article in Nature (Vol-448, 2 August 2007) under “News and Views” by Prof. Peter Pilewskie. In the same issue, Ramanathan et al. (on page 575) report that the aerosol clouds above large regions of Asia actually cause as much warming as greenhouse gases — in contradiction, at first glance, to the notion of aerosol particles as a cooling agent.


Figure 1. Smog drifts down India's populous Ganges valley and out into the Bay of Bengal. This is the source of 'atmospheric brown clouds' over the Indian Ocean, and the climatic effect of its constituent aerosol particles is investigated by Ramanathan and colleagues


For more information and understanding, please refer following two articles and references therein:

Pilewskie, P., 2007, Aerosols heat up, Nature 448, 541-542.

Ramanathan et al. 2007, Warming trends in Asia amplified by brown cloud solar absorption, Nature 448, 575-578.

Sunday, August 12, 2007

Aerosol Optical Thickness: MODIS Improved Product over Land

MODIS aerosol optical thickness (AOT) retrieval algorithm over land is continuously improving and now operational to produce collection 5 aerosol data products. Both Terra and Aqua data has been reprocessed using new retrieval algorithm. Click here to view current data processing status. New algorithm replaced the surface reflectance assumptions, the set of aerosol model optical properties, and the aerosol lookup table to reduce uncertainty in the product. In collection 5 retrievals of small-magnitude negative AOT values (down to −0.05) are considered valid, thus balancing the long term statistics of τ in near zero AOT conditions. Initial validation exercise conducted on this algorithm shows much improved retrievals of AOT. As consequence, global mean AOT for the test bed is reduced from ∼0.28 to ∼0.21.


Last month two research articles published in JGR-Atmosphere discussing new algorithm:


Monday, August 6, 2007

International Symposium on Aerosol Chemistry Climate Interactions

My alma mater Physical Research Laboratory, Ahmedabad, India is holding an International Symposium on Aerosol-Chemistry-Climate Interactions

Symposium will be from 20-22 November 2007. Last date to send abstract is 31 August 2007.

The topics covered are

1. Observations of Atmospheric Parameters
Measurements of trace gases, aerosols, using in situ and remote sensing techniques

2.
Transport and Transformation of Trace Gases and Aerosols
Long range and inter-continental transport, and stratosphere-troposphere exchange

3. Modeling of Atmospheric Processes
Emission inventories, sinks, model development and evaluation

4. Radiative Forcing and Climate Change
Aerosol-cloud interactions, impact on environment and climate

5. Space Instrumentation for Probing the Lower Atmosphere
Advances and developments in space techniques, sensor characterization and retrieval algorithms

Limited traveling and registration fee support will be provided to young scientists (below 35 years). For more information refer to conference web-page at http://www.prl.res.in/~acclint2007

Monday, July 30, 2007

Remote Sensing of Spectral Aerosol Properties: A Classroom Experience


From my graduate school experience I find that the best way to learn and understand science is by getting your hands dirty with the relavant data when it comes to understanding remote sensing. Like remote sensing courses at many other universities in the United States, the University of Alabama in Huntsville offers two courses in Satellite Remote Sensing, ATS670 and ATS770. These courses are tailored in a manner to that allows students to get hands on experience with state-of-the art remote sensing datasets such as the MODIS . In ATS670, students select a MODIS image of their interest and perform a supervised and unsupervisd classification of the image to identify different features in the image such as land, water, clouds, aerosols, vegetation etc. The beauty of doing all this is that the student doesn't get to use any classification software! They write their own routines to perform all the required tasks including trivial tasks such as calculating minimum, maximum, mean, standard deviation to more sophisticated tasks such as histogram equalization, contrast streching, gray flipping, edge detection, fire detection, cloud detection in images to name a few. The journey begins with learning the basic principles of remote sensing and understanding the fundamentals behind seperating features in a remotely sensed image based on spectral signatures. Once the basics unfold, students write their own programs to read the MODIS image, perform a true color three band overlay, pick samples, perform image classification using several techniques such as the parellelopiped method, migrating means method, minimum distance, maximum likelihood methods and the mahalonobis classifier. The ingredients of this course a perfect blend of theoritical and practical classroom learning. ATS770 is more advanced and students use several radiative transfer models and other remote sensing tools to perform retrievals such as for cloud and aerosol properties.
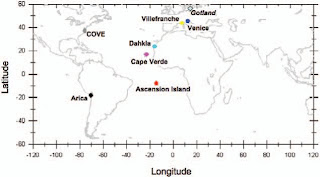
Having taken these courses I have a great appreciation of hands-on experience in learning remote sensing and this is what attracted my attention to a paper by Robert Levy that appeared in the BAMS, 2007 (reference below). This paper talks about the challenge instructors face in bridging the gap between current research and the classroom and how the University of Maryland and NASA Goddard Space Flight Center teamed up to "design a graduate class project intended to provide a hands-on introduction to the physical basis for the retrieval of aerosol properties from state-of-the-art Moderate Resolution Imaging Spectroradiometer (MODIS) observations". "This paper reviews the basic physics of the remote sensing of aerosols and describes selected findings and lessons learned by the students." Students use both hand calculations based on given look-up tables of aerosol properties and the operational MODIS aerosol retrieval algorithm to carry out the class project. Aerosol retrievals are done over selected AERONET sites (shown in figure below) that aid validation of retrieved products.


Students investigated the reflectance v/s wavelength relations over these sites and they find a surface dependence. Figure alongside shows retrievals obtained by hand calculations by using selected fine and coarse mode geometries of aerosols and the fitting error was estimated to find the best fit. Overlaid is the MODIS retrieval in black. Best fit spectral AOT retrievals were then compared with AERONET AOTs . Details on the codes used and the instructions to perform the exercises is given at :


This paper illustrates how " Projects such as this provide an opportunity for students and young scientists to become familiar with (and less apprehensive of) datasets of this magnitude". This paper is a must read for all those interested in learning aerosol retrieval techniques.


References :

Levy, R.C., and R.T. Pinker, 2007: Remote Sensing of Spectral Aerosol Properties: A Classroom Experience, Bull. Amer. Meteor. Soc., 88, 25–30

http://www.nsstc.uah.edu/~sundar/ats670.html

http://www.nsstc.uah.edu/~sundar/ats770.html


Friday, July 20, 2007

Levoglucosan: a unique tracer of biomass burning aerosols

Atmospheric aerosols in general and biomass burning aerosols in particular have recently attracted extensive interest owing to their ability to affect the climate on local to global scales. These climatic effects include a direct radiative effect due to the aerosols’ ability to scatter and absorb incoming sunlight, an indirect effect due to the aerosols’ ability to serve as cloud condensation nuclei (CCN), increasing the cloud’s reflectivity and lifetime, a semidirect effect which leads to reduction in cloud cover, owing to aerosols’ ability to absorb sunlight, changes in precipitation patterns, and export of pollutants and water vapor to the stratosphere. Therefore, it is important to assess human contribution to aerosol emissions, and to assign a source to both anthropogenic and natural aerosols, for understanding the respective contribution of different aerosol types to climate change.

Levoglucosan (1,6-anhydro-β-D-glucopyranose) is a unique tracer for biomass burning sources in atmospheric aerosol particles. It is a product of cellulose combustion, which has been recognized as a biomass burning tracer. When cellulose is heated to over 300°C, it undergoes various pyrolytic processes, yielding a highly combustible tar, a major constituent of which is levoglucosan, a dehydrated glucose containing a ketal functional group. Some of the levoglucosan is consumed in various reactions during combustion but it is nonetheless emitted in large quantities in the resulting smoke aerosol. Therefore, it can be utilize as a specific tracer for the presence of emissions from a biomass burning source in atmospheric particulate matter. Unlike other indicators used for the same purpose, levoglucosan is source-specific to burning of any fuel containing cellulose. Combustion of other materials (e.g., fossil fuels) or biodegradation and hydrolysis of cellulose do not produce levoglucosan. Levoglucosan is relatively stable in the atmosphere, showing no decay over 10 days in acidic conditions, similar to those of atmospheric liquid droplets. Levoglucosan is also used in other fields of chemistry and engineering, such as pyrolysis and fire-retardants research, biofuel research, biology, organic synthesis and as a biomass burning tracer in sediment analysis for the paleorecord.
For more information, please see the following paper and references therein.

Schkolnik G. and Rudich Y. (2006), Detection and quantification of levoglucosan in atmospheric aerosols: A review, Analytical and Bioanalytical Chemistry, 385, 26-33.

Monday, July 16, 2007

Atmospheric Aerosol and Ultraviolet Radiation

Ultraviolet (UV) radiation plays very important role in bio-geo-chemical cycle. Their harmful effects include skin cancer, cataract, immune suppression, reduction in crop yield, etc. Beneficial effects are synthesis of vitamin D in human body, treatment of psoriasis, etc (Lucas et al., 2006). My interest in UV radiation is how it interacts with atmospheric aerosols.

Aerosols are one of the many factors which determines amount of surface reaching UV radiation. While scattering type of aerosols may reduce surface reaching UV radiation, they increase the actinic flux which in turn increases the photolysis rate for smog formation (Dickerson et al., 1997). Relation of aerosol and UV radiation is not one-way; while aerosols affect surface reaching UV radiation, they are affected by surface reaching UV radiation. This is particularly true for naturally produced sulfate aerosol. Recently scientific community has shown a lot of interest to study UV induced sulfate aerosol production to better understand effect solar variability on climate change. Joyce Penner presented a talk on connection between Solar variability, Dimethyl sulfide (DMS) production, and climate change in Yoram Kaufman Symposium on Aerosols, Clouds and Climate (30-31 May 2007). The symposium was organized in honor of Yoram Kaufman at Goddard Space Flight Center, NASA, Maryland, USA. Presentations are available for download at this link.

Penner presented the details on solar variability and DMS production and showed how the matter is complicated due to cloud feedback. The connection works as following; increase in ultraviolet radiation decreases the marine biota, which in turn reduces production of DMS . Reduction in DMS reduces aerosol amount, which ultimately leads to cloud modification. The poorly understood connections between aerosol and cloud as well as cloud and marine biota makes it difficult to interpret solar variability connection of climate change. Two references cited repeatedly in her talk were Larsen (2005) and Vallina and Simo (2007).

References:-

Lucas, R., T. McMichael, W. Smith. and B. Armstrong (2006), Global burden of disease from solar ultraviolet radiation, Environmental burden of diseases series no. 13, ed. A. Pruss-Ustun, H. Zeeb, C. Mathers and M. Repacholi, World Health Organization Public Health and the Environment, Geneva, 2006.

R. R. Dickerson, S. Kondragunta, G. Stenchikov, K. L. Civerolo, B. G. Doddridge, and B. N. Holben, The Impact of Aerosols on Solar Ultraviolet Radiation and Photochemical Smog , Science 31 October 1997 278: 827-830 [DOI: 10.1126/science.278.5339.827]

Larsen, S. H. (2005), Solar variability, dimethyl sulphide, clouds, and climate, Global Biogeochem. Cycles, 19, GB1014, doi:10.1029/2004GB002333.

Vallina, S. M. and R. Simo (2007), Strong Relationship Between DMS and the Solar Radiation Dose over the Global Surface Ocean, Science, Vol. 315, No. 5811. pp. 506-508

Sunday, July 8, 2007

Carbon Aerosols in Climate Models

"All models have assumed that particles are spherical and have chosen single values for the refractive index. If underlying model assumptions are inappropriate, then scattering, absorption and radiative forcing estimates will be incorrect."

This is one the statement made by Tami Bond and Robert Bergstrom in the review paper titled ‘Light Absorption by Carbonaceous Particles: An Investigative Review’ published in Aerosol Science and Technology, 2006.

I had chance to present this paper as class seminar in my ‘Atmospheric Aerosol’ class teaching by Dr. Kirk Fuller during this summer. Let me tell you this, “this is one of the best written paper I ever read on carbon aerosols”. It reads very well and has almost all the information you need to know about atmospheric carbon aerosols and their optical properties. Personally, I congratulate and thanks Tami and Robert for putting together this wonderful paper. Below, I will briefly touch some important points from the paper.

Motivation:

Tabulation of optical properties needs update and measured absorptive properties demonstrate variability that has not been represented in climate models.

Key Conclusion:

Optical properties of Light Absorbing Carbon (LAC) are necessary to model its effects on climate.
Mass absorption cross-section is 7.5±1.2 m2/g for at λ=0.55 µm uncoated LAC.
Highest refractive index for strongly absorbing LAC is 1.95-i*0.79 with narrow range and refractive index values used in current climate models are in error.
Spherical aggregates treatment using realistic refractive indices under predict measured absorption by about 30%

Recommendations:

Mass absorption cross-section 7.5±1.2 m2/g at λ=0.55 µm for fresh LAC, this may increase due to coating and decrease due to particle coagulation.

Single scattering albedo: 0.2-0.3 for fresh LAC.

Absorption cross-section may be assumed to depend inversely on wavelength throughout the visible spectrum.

Refractive index (m=1.74-i0.44) commonly used by climate models should be retired and new values between 1.75 – i0.63 and 1.95- i0.79 should be used.

Mie calculation should not be used for fresh LAC but coated sphere type Mie calculation can be used for aged LAC.
Reference:
Light Absorption by Carbonaceous Particles: An Investigative Review TC Bond, RW Bergstrom - Aerosol Science & Technology, 2006, ISSN: 0278-6826.

Monday, July 2, 2007

Accurate Monitoring of Terrestrial Aerosols and Total Solar Irradiance : Introducing the Glory Mission

Its time for aerosol scientists to gear up for the upcoming Glory Mission that has a fantastic passive sensor for monitoring aerosols from space with unmatched retrieval accuracies of 0.02 over ocean and 0.04 over land!

This article on the Glory Mission appeared in BAMS in the May 2007 edition, volume 88, number 5. It has a very detailed description of the science objectives, the instruments on Glory, measurement objectives, the data products from these instruments, associated uncertainties and validation plans.
Glory is basically a part of the A-Train constellation of satellites. It is scheduled to be launched in 2008 and will carry two independent instruments :
1) The Total Irradiance Monitor (TIM)

2) The Aerosol Polarimetry Sensor (APS)
The main purpose of the Glory mission is to help address the challenge of reducing uncertainty in adequately contraining climate sensitivity. Glory is intented to specifically meet the following four scientific objectives :

" • improve the quantification of the effect of solar variability on the Earth’s climate by continuing the uninterrupted 28-yr satellite measurement record of TSI;

• facilitate the quantification of the aerosol direct and indirect effects on climate by determining the global distribution of the optical thickness and microphysical properties of natural and anthropogenic aerosols and clouds with much-improved accuracy;

• provide better aerosol representations for use in various remote sensing retrievals, thereby allowing improvements in aerosol assessments by other operational satellite instruments; and

• provide an improved framework for the formulation of future comprehensive satellite missions for aerosol, cloud, and ocean color research. "

The APS will offer along track measurements for 3 years of mission life. It has the following unique measurement capabilities to ameliorate the ill-posed inverse problem and hence improve aerosol retrieval accuracies:

" • to measure not only the intensity, I, but also the other Stokes parameters describing the polarization state of the reflected radiation (i.e., Q, U, and V; Hansen and Travis 1974);

• to increase the number of spectral channels and the total spectral range covered;

• to increase the number and range of viewing directions from which a scene location is observed; and
• to improve the measurement accuracy, especially for polarization "

The aerosol and cloud products from APS will be delivered at ~6 km spatial resolution (nadir) and initial data will be made available within 6 months after launch ! Aerosol data products include columnar spectral aerosol optical thickness, aerosol effective radius, effective variance of the aerosol size distribution, aerosol spectral real refractive index and aerosol spectral single scattering albedo.

For more details please refer to the following :

Mishchenko, M.I., B. Cairns, G. Kopp, C.F. Schueler, B.A. Fafaul, J.E. Hansen, R.J. Hooker, T. Itchkawich, H.B. Maring, and L.D. Travis, 2007: Precise and accurate monitoring of terrestrial aerosols and total solar irradiance: Introducing the Glory mission. Bull. Amer. Meteorol. Soc., 88, 677-691, doi:10.1175/BAMS-88-5-677.


Tuesday, June 26, 2007

Radionuclides in Aerosols

7Be and 210Pb are the natural radionuclides present in the atmosphere. Several studies have shown that useful information about transport, removal and residence time of aerosols in the atmosphere can be obtained from the measurements of 7Be and 210Pb. 7Be (half-life = 53.3 days) is produced by cosmic ray spallation of nitrogen and oxygen primarily in lower stratosphere and upper troposphere. Therefore, 7Be is used as a tracer of stratospheric or high tropospheric sources such as ozone, stratospheric bomb fallout debris, stratospherically injected volcanic components. In contrast, 210Pb (half-life = 22.3 years) is a progeny of 238U. The source of 210Pb is radioactive decay of 222Rn (half-life = 3.8 days), a noble gas, continuously emitting from soils to the atmosphere. Thus, 210Pb is a tracer of continental air as more than 99% 222Rn is emanating from the surface of continents. Half-life of both the radionuclides are long enough with respect to their residence time in the lower atmosphere, therefore the principal removal pathway of the 7Be and 210Pb is via dry and wet deposition rather than radioactive decay. Since the sources of 7Be and 210Pb are well established and different in terms of altitude, their simultaneous study provides useful information about the vertical and horizontal mixing of air masses in the atmosphere. For further study, please see the following references and references therein.

Balkanski, Y. J., D. J. Jacob and G. M. Gardner (1993), Transport and residence times of tropospheric aerosols inferred from a global three-dimensional simulation of 210Pb, J. Geophy. Res., 98, 20573–20586.

Graustein, W. C. and K. K. Turekian (1996), 7Be and 210Pb indicate an upper troposphere source for elevated ozone in the summertime subtropical free troposphere of the eastern North Atlantic, Geophys. Res. Lett., 23, 539-542.

Gaffney, J. S., N. A. Marley and M. M. Cunningham (2004), Natural radionuclides in fine aerosols in the Pittsburgh area, Atmos. Environ., 38, 3191-3200.

Lee, H. N., L. Tositti, X. Zheng, and P. Bonasoni (2007), Analyses and comparisons of variations of 7Be, 210Pb, and 7Be/210Pb with ozone observations at two Global Atmosphere Watch stations from high mountains, J. Geophys. Res., 112, D05303, doi:10.1029/2006JD007421.

Tuesday, June 12, 2007

New Dimension to Aerosol Research: CALIPSO the Space LIDAR

NASA in collaboration with CNES, BALL, IPSL and Hampton University launched state-of-art dual channel space LIDAR on April 28, 2006. Cloud-Aerosol Lidar and Infrared Pathfinder Satellite Observation (CALIPSO) is flying in constellation of satellites called A-Train along with Aura, PARASOL, CloudSat, Aqua, taking Earth observations within 7-8 minutes and OCO will soon join them to complete the A-Train.

CALIPSO took its first observation (image on right) on July 24, 2006 and last December its level 1 radiance, lidar level 2 vertical feature masks, cloud and aerosol layer products are released to the public. These data sets are unique in various ways and will provide new dimension (vertical) to the aerosol research. CALIPSO provides long awaited global vertical profiles of aerosols in the atmosphere, which will be very useful for air quality, earth radiation budget and climate change studies. An example is shown below: Read More About Image Here
This graphic shows a flight comparison between CALIPSO data (middle) and data taken from the cloud physics lidar on the ER-2 (bottom) from the same time a location on August 12. The image at the top is infrared data from a GOES satellite illustrating the cloud cover that both the CALIPSO and the ER-2 lidars observe. The flight path of the ER-2 and the CALIPSO track can be seen at the right of the image as a solid line


Here in this blog post, I am providing some useful link to CALIPSO and its data sets

CALIPSO Home
http://www-calipso.larc.nasa.gov/

Watch great movie of A-train orbits
http://www-calipso.larc.nasa.gov/about/

More about A-train
http://www-calipso.larc.nasa.gov/about/atrain.php

CALIPSO outreach
http://calipsooutreach.hamptonu.edu/index.htm

CALIPSO Data page
http://eosweb.larc.nasa.gov/PRODOCS/calipso/table_calipso.html

CALIPSO Image browser
http://www-calipso.larc.nasa.gov/products/lidar/

Monday, June 4, 2007

Atmospheric radiative effects of an in-situ measured Saharan dust plume and the role of large particles

This interesting paper appeared in ACPD on June 4 and abstract reads :

This work will present aerosol size distributions measured in a Saharan dust plume between 0.9 and 12 km altitude during the ACE-2 campaign 1997. The distributions contain a significant fraction of large particles of diameters from 4 to 30 μm. Radiative transfer calculations have been performed using these data as input. Shortwave, longwave as well as total atmospheric radiative effects (AREs) of the dust plume are investigated over ocean and desert within the scope of sensitivity studies considering varied input parameters like solar zenith angle, scaled total dust optical depth, tropospheric standard aerosol profiles and particle complex refractive index. The results indicate that the large particle fraction has a predominant impact on the optical properties of the dust. A single scattering albedo of ωo=0.75–0.96 at 550 nm was simulated in the entire dust column as well as 0.76 within the Saharan dust layer at ~4 km altitude indicating enhanced absorption. The measured dust leads to cooling over the ocean but warming over the desert due to differences in their spectral surface albedo and surface temperature. The large particles absorb strongly and they contribute at least 20% to the ARE in the dusty atmosphere.

From the measured size distributions modal parameters of a bimodal lognormal column volume size distribution were deduced, resulting in a coarse median diameter of ~9 μm and a column single scattering albedo of 0.78 at 550 nm. A sensitivity study demonstrates that variabilities in the modal parameters can cause completely different AREs and emphasises the warming effect of the large mineral dust particles

Reference :

S. Otto, M. de Reus, T. Trautmann, A. Thomas, M. Wendisch, and S. Borrmann, Atmospheric radiative effects of an in-situ measured Saharan dust plume and the role of large particles, Atmos. Chem. Phys. Discuss., 7, 7767-7817, 2007

Monday, May 28, 2007

14C, a proxy of ‘biomass burning’ versus ‘fossil fuel combustion’ contribution to carbonaceous aerosols

Carbonaceous aerosols (organic and elemental carbon) in the atmosphere are produced by biomass burning and fossil fuel combustion but their relative contribution is not properly known. Radiocarbon (14C) is present in living and recently living material at an approximate concentration of one 14C atom per 10^12 ordinary carbon atoms (12C + 13C). This equilibrium amount is a result of the gain of 14C from its steady production by cosmic rays spallation reaction with nitrogen in the atmosphere (some fraction of which is taken up by the biosphere through photosynthesis in the form of 14CO2) versus the loss of 14C from its radioactive decay (5730 y half-life). However, 14C is absent from fossil fuels because of the ancient age of fossil carbon (due to radioactive decay to unmeasurably small amounts). This dichotomy is the basis of inferring the fraction of fossil carbon in an ambient aerosol sample by comparing its 14C content to that of living material, a methodology that has become increasingly popular in recent years. For detail, please see Charles et al (2006) and references therein.

Reference:
Charles W. L., John, V., James, N. B., William S. C., William A. L., and Ann P. M., 2006, Absence of 14C in PM2.5 Emissions from Gasohol Combustion in Small Engines, Aerosol Science and Technology, 40:657–663.

Monday, May 21, 2007

Cloud Properties Using Zenith Radiance Measurement

Last Thursday Warren Wiscombe was in my department (AOSC, Univ of Maryland) to give a talk. Many of us have greatly benefited from radiative transfer code DISORT. He is a co-author to that code. He has written few other excellent algorithms and code for atmospheric remote sensing. His code for the Mie scattering can be downloaded here.

His talk was about deriving cloud properties using ground based zenith radiance measurements. Focus of the talk was cloud optical depth. Cloud optical depth is very important parameter for climate modeling as can be understood from the fact that at any time more than 60% of the earth’s sky is covered with cloud. Cloud optical depth (COD) can range anywhere between 1 and 80+. In spite of such high importance, not only it is poorly understood parameter but also a challenging task to measure it. Turner et al. (2007) highlight this problem by showing five different techniques resulting in five different values for same cloud (see figure).
Figure from Turner et al. (2007)
Warren described narrow field of view zenith radiometer (NFOV) in detail. Unlike aerosol where ground based measurements are concerned mostly with transmitted photons, zenith radiance measurements in presence of cloud have to deal with both transmitted and backscattered photons. When a cloud is thin, increasing cloud optical depth increases number of scattered photons, but after reaching a peak value further increase in cloud optical depth results in attenuation of photons. Hence we are in a situation where we have same radiance value for two different cloud optical depths.

One can overcome this problem using spectral measurements, if geography of a place supports it. Green vegetation reflects predominantly near-infrared-radiation (NIR). If measurements are made at a place, which is surrounded by green vegetation, zenith radiance flux will have spectral signature depending on scattered photons are coming from the Sun (thin cloud) or reflected from the Earth (thick cloud). Wiscombe and his group are developing a new NFOV, which makes measurement over 240 wavelengths bands. That is just in one second!

I highly recommend reading Turner et al (2007) paper to get insight into challenges associated with cloud remote sensing.

Reference
Turner et al. (2007), “Thin Liquid Water Clouds: Their Importance and Our Challenge”, Bull. American Meteo. Soc, vol 88(2), 177-190, DOI:10.1175/BAMS-88-2-177

Correction:

In a reply to my e-mail. Warren has pointed out following about NFOV.


I wrote " One can overcome this problem ... if geography of a place supports it"

It is not geography but only whether or not there is enough green vegetation around, for at least a horizontal distance equal to the vertical distance to cloud base.

I wrote "Wiscombe and his group are developing a new NFOV, which makes measurement over 240 wavelengths bands."

Peter Pilewski of U Colorado developed this spectrometer under contract to ARM. However, Wiscombe and his group urged its development for years and are its biggest users.

Sunday, May 13, 2007

AERONET Web Services: New look and Tools

AERONET (AERosol RObotic NETwork) is a well known, most used aerosol observation system, which provides most reliable measurements of different aerosol optical properties from their ground stations around the world. Some time ago, AERONET team has updated their web services. The new look of website is really cool and site contains almost everything you want to know about AERONET and their data. It contains all of the major publications, which used AERONET data.

The most fascinating and very useful tool they have is ‘data synergy tool’. It is really amazing for quick research and great visualization of various aerosol properties from AERONET, satellites, models, LIDARs, ozone, back trajectory, and even weather charts over any particular AERONET station.

Here is link to the synergy tool

http://aeronet.gsfc.nasa.gov/cgi-bin/bamgomas_interactive

and link to the main AERONET page

http://aeronet.gsfc.nasa.gov/

So, take some time and admire the AERONET facilities available for atmospheric aerosol research community.

Personally, I really thank the AERONET team and congrats them for their great work and services.

Monday, May 7, 2007

Long-Term Satellite Record Reveals Likely Recent Aerosol Trend

In the recent decade aerosols have gained much attention from a climate perspective. Researchers have been using both observations and modeling studies to address the question on radiative effects of aerosols and their role in global climate change. Ground based observations have provided unmatched understanding of aerosol optical and microphysical properties. Sophisticated remote sensing instruments such as MODIS, MISR, OMI, TOMS onboard various satellite platforms provide routine measurement of aerosol loading over the entire globe.

While much attention was being paid on characterizing aerosols and understanding their radiative effects not much speculation was done over their concentration trends over past decade or so until recently. An interesting paper appeared in Science on March 16, 2007 by Michael Mishchenko et al on “Long-Term Satellite Record Reveals Likely Recent Aerosol Trend “. They analyzed the Global Aerosol Climatology Project (GACP) data set to show a decrease in global tropospheric aerosol optical thickness by 0.03 during the period from 1991 to 2005.

http://www.nasa.gov/centers/goddard/news/topstory/2007/aerosol_dimming.html

Global Diming : Wikipedia

Comments on this paper also appeared in the same issue raising question on the dataset used, for example, the AVHRR observations that goes into GACP data set is questionable in the first place because AVHRR with limited channels was not really designed for aerosol retrieval. Cloud contamination was also in question. AVHRR retrieval was also the first question that came to both me and one of my colleagues Pawan Gupta. We discussed this issue and came up with the thought that MODIS and MISR being instruments meant to retrieve aerosol concentration (aerosol optical thickness => AOT) information should throw some light into this because they have been flying onboard Terra satellites since 1999. That gives a time series of 6 years (2000 – 2006). Mr Gupta generated the AOT trend plots shown below. The first figure overlays MODIS (red) and MISR (yellow) monthly mean AOT values over GACP AOT trend (blue). MODIS-MISR decreasing trends agree with each other both in trend and in magnitude though they do not agree in magnitude with GACP. But the key result is that all the three dataset do show a decreasing trend (see zero AOT line for reference).


A closer look annual mean AOT trends (figure below) separately over Land (from MISR) and Ocean (from MODIS) and global mean renders the same result – net decreasing trend in annual mean AOT.


These results along with study by Mishchenko et al., (2007) raise interesting questions on both global warming and global diming and their offset. How does this fit into what we observe around us? Is the decrease in aerosol concentration contributing to increase in global warming? What are some loop holes in understanding this debate and assimilating what data shows?


Acknowledgement : A special thanks to Mr Pawan Gupta for sharing some of his results (the two figures above) for this article.


Reference:

Michael I. Mishchenko, Igor V. Geogdzhayev, William B. Rossow, Brian Cairns, Barbara E. Carlson, Andrew A. Lacis, Li Liu, and Larry D. Travis (16 March 2007)
Science 315 (5818), 1543. [DOI: 10.1126/science.1136709]

Tuesday, April 24, 2007

Jim Hansen receives Dan David Prize

The DAN DAVID PRIZE annually awards 3 prizes of US$ 1 million each for achievements having an outstanding scientific, technological, cultural or social impact on our world. Each year fields are chosen within the three Time Dimensions - Past, Present and Future. Another interesting fact about Dan David Prize is that recipients donate 10% of their prize money to graduate students in their respective field.

The 2007 Dan David Prize honors Dr. James Hansen for his significant contributions in the field of "Quest for Energy". He will be sharing the award with Sarah Kurtz and Jerry Olson.

James Hansen is a towering figure in atmospheric aerosol research. His paper with Lacis in Nature (doi:10.1038/346713a0) has been used by many to show the importance of atmospheric aerosols in earth's radiation budget. I was so impressed by his paper with Menon, Nazarenko and Luo in Science (doi:10.1126/science.1075159) about climatic effect of black carbon in China and India that I decided to pursue it further during my tenure as post doctoral research fellow at Physical Research Laboratory.

Dan David Prize recognizes James Hansen for his seminal contribution for (a) understanding of the various forces that govern Earth's radiation budget whereby increasing amounts of trace gases and aerosols in the atmosphere prevent the escape of terrestrial infrared energy, thereby causing the planet to warm; (b) understanding the changes to Earth's energy balance through large scale calculations with general circulation models and studies of paleoclimatic data; and (c) quantitative assessment of global thermometric records to document changes in Earth's mean surface temperature in response to these energy restrictions. These calculations confirm the natural greenhouse effect of about 32 degrees C that was already in existence prior to the Industrial Revolution, and the augmented effect of about 0.8 degrees C from the atmospheric concentration increases observed during the late 20th Century for carbon dioxide, methane, nitrous oxide, and other gases and aerosols.

My heartiest congratulations to James Hansen for his well deserving achievement.

Links
(1.) http://en.wikipedia.org/wiki/James_Hansen

(2.) http://www.columbia.edu/~jeh1/

(3.) http://www.dandavidprize.org/

References

* Hansen, J. E., and Lacis A. A. (1990), Sun and dust versus greenhouse gases: an assessment of their relative roles in global climate change, Nature, 346,713-719.

* Menon, S., J Hansen, L. Nazarenko, and Y Luo (2002), Climate Effects of Black Carbon Aerosols in China and India, Science, 297, 2250-2253.

Sunday, April 15, 2007

Global Aerosol Sources: Synergy of Satellite and Model

This paper by Dubovik et al., appeared online in Atmos. Chem. Phys. Discuss.

The abstract read as

"Knowledge of the global distribution of tropospheric aerosols is important for studying the effects of aerosols on global climate. Chemical transport models rely on archived meteorological fields, accounting for aerosol sources, transport and removal processes can simulate the global distribution of atmospheric aerosols. However, the accuracy of global aerosol modeling is limited. Uncertainty in location and strength of aerosol emission sources is a major factor in limiting modeling accuracy. This paper describes an effort to develop an algorithm for retrieving global sources of aerosol from satellite observations by inverting the GOCART aerosol transport model.
To optimize inversion algorithm performance, the inversion was formulated as a generalized multi-term least-squares-type fitting. This concept uses the principles of statistical optimization and unites diverse retrieval techniques into a single flexible inversion procedure. It is particularly useful for choosing and refining a priori constraints in the retrieval algorithm. For example, it is demonstrated that a priori limitations on the partial derivatives of retrieved characteristics, which are widely used in atmospheric remote sensing, can also be useful in inverse modeling for constraining time and space variability of the retrieved global aerosol emissions. The similarities and differences with the standard "Kalman filter" inverse modeling approach and the "Phillips-Tikhonov-Twomey" constrained inversion widely used in remote sensing are discussed. In order to retain the originally high space and time resolution of the global model in the inversion of a long record of observations, the algorithm was expressed using adjoint operators in a form convenient for practical development of the inversion from codes implementing forward model simulations.
The inversion algorithm was implemented using the GOCART aerosol transport model. The numerical tests we conducted showed successful retrievals of global aerosol emissions with a 2°×2.5° resolution by inverting the GOCART output. For achieving satisfactory retrieval from satellite sensors such as MODIS, the emissions were assumed constant within the 24 h diurnal cycle and aerosol differences in chemical composition were neglected. Such additional assumptions were needed to constrain the inversion due to limitations of satellite temporal coverage and sensitivity to aerosol parameters. As a result, the algorithm was defined for the retrieval of emission sources of fine and coarse mode aerosols from the MODIS fine and coarse mode aerosol optical thickness data respectively. Numerical tests showed that such assumptions are justifiable, taking into account the accuracy of the model and observations and that it provides valuable retrievals of the location and the strength of the aerosol emissions. The algorithm was applied to MODIS observations during two weeks in August 2000. The global placement of fine mode aerosol sources retrieved from inverting MODIS observations was coherent with available independent knowledge. This was particularly encouraging since the inverse method did not use any a priori information about the sources and it was initialized under a "zero aerosol emission" assumption. The retrieval reproduced the instantaneous global MODIS observations with a standard deviation in fitting of aerosol optical thickness of ~0.04. The optical thickness during high aerosol loading events was reproduced with a standard deviation of ~48%. Applications of the algorithm for the retrieval of coarse mode aerosol emissions were less successful, mainly due to the currently existing lack of MODIS data over high reflectance desert dust sources.
Possibilities for enhancing the global satellite data inversion by using diverse a priori constraints on the retrieval are demonstrated. The potential and limitations of applying our approach for the retrieval of global aerosol sources from aerosol remote sensing are discussed."


Complete reference of the article is

Dubovik, O., Lapyonok, T., Kaufman, Y. J., Chin, M., Ginoux, P., and Sinyuk, A.: Retrieving global sources of aerosols from MODIS observations by inverting GOCART model, Atmos. Chem. Phys. Discuss., 7, 3629-3718, 2007.

Update (2008-12-30)
The above reference is for discussion paper. The final version of paper can be found at following link.

Dubovik, O., Lapyonok, T., Kaufman, Y. J., Chin, M., Ginoux, P., Kahn, R. A., and Sinyuk, A.: Retrieving global aerosol sources from satellites using inverse modeling, Atmos. Chem. Phys., 8, 209-250, 2008.

Monday, April 9, 2007

Wikipedia's Role in Science Education and Outreach, EOS, Vol 88, Number 11, 13 March 2007

I ran into this article a while ago on EOS transactions (Vol 88, Number 11, 13 March 2007) and it made me pause and think on the message in the article. I thought it was something worth paying attention to and hence decided to post it here for us to contribute to the thought.
The purpose of the article was to inform the scientific community of the popularity of Wikipedia and to urge the experts in the community to take a look at the Wikipedia entry for one's area of expertise. The author raises concerns because of the fact that Wikipedia articles are encyclopedic by nature and so provide students with an apparently complete source of material for use in reports and research projects. The question then is: "how good is Wikipedia" in terms of completeness and accuracy? Are students learning the right things? To make Wikipedia as current and updated as possible in terms of information, it allows Anyone with internet connection to write an article about any topic or edit any existing article. This strength also becomes its weakness because the entries are anonymous and hence could lead to vandalism as well as articles by nonexperts. The article cites several examples to show how many articles in Wikipedia are very well written while others contain erros and misconceptions or are incomplete. Hence, the author urges the scientists to be familiar with how their fields are described on Wikipedia and, if interested, to write Wikipedia articles or edit articles that contain errors or are incomplete because that way scientists can play a role in education and public outreach realm.
Inspired from this article, I took a look at AEROSOL information on wikipedia and found that indeed this portion of the Wikipedia needs a lot of contribution in terms of completeness and referencing. For example, a definition on aerosols was found but there were no references that could lead to further reading on the definition. While Wikipedia mentions PM10 as particulate matter, there is no mention of PM2.5 or PM0.1. There is a statement that says " Averaged over the globe, anthropogenic aerosols—those made by human activities—currently account for about 10 percent of the total amount of aerosols in our atmosphere ". Such numbers must be backed with peer reviewed references.
Going on to my area of interest, I took a brief look at aerosol radiative information on Wikipedia. Again, this information was not complete for a novice reader/researcher. There are several landmark papers in this field that need to be appended in this section. The section briefly mentions the limitations of aerosol observation and hence the use of modeling in estimating global forcing. There is multitude of both regional and global aerosol forcing research based on observations and modeling that needs to be inculcated in this section and referenced. The widely popular topics of global warming and diming seem to be most updated on the Wikipedia. The completeness of which is again under a question mark. This section needs the attention of experts in this field because incomplete information could lead to misconceptions on this intricate subject.
The present article is written with an interest to promote the thought in the EOS article and their recommendations on contributing towards education and outreach.
Complete References :
Wikipedia's Role in Science Education and Outreach, EOS, Transcactions, AGU, Vol 88, Number 11, Pg 134-135, 13 March 2007