Wednesday, January 31, 2007

Monitoring of Atmospheric Aerosols Using MISR

NASA launched its first Earth Observing System satellite Terra in May 1999 with five different sensors onboard to monitor and study earth-atmosphere system. MISR is one of the instruments, which is primarily designed to study aerosols and clouds. More on MISR instrument is given in previous post by Harish in the same blog. Since the launch, MISR is providing good quality data of various aerosol properties over global ocean and land. Multi-angle capability of MISR enables retrieval of aerosol properties over both dark and bright targets, which is not available from other sensors such as MODIS. The most important parameter in aerosol research is aerosol optical thickness (AOT), which indirectly tells us columnar loading of aerosols in the earth-atmosphere system. Validation exercise shows that 67% time AOT are within ±0.05 or 20% of AEROENT AOT (Kahn et al., 2005, Abdou et al., 2005, Christopher and Wang, 2004, Martonchik et al., 2004 and Jiang et al., 2006). Also, the accuracies are higher over clean oceans relative to desert sites over land. Apart from AOT, MISR also retrieve single scattering albedo (SSA), angstrom coefficient, and size segregated AOTs, although these parameters are still under validation stage. MISR data have been used in several research studies for various purposes. Recently, MISR visible images have been used to map the path of smoke plumes coming out from world trade center after September 11, 2001 incident (for more details click here). MISR along with other radiation data sets also have been used in estimating direct radiative effects of aerosols in shortwave and longwave part of the solar spectrum (Zhang and Christopher et al., 2003). Several recent research studies have shown the potential of MISR aerosol products in monitoring and forecasting particulate matter air pollution over global urban areas (Liu et al., 2004 and Donkelaar et al., 2006). MISR is very useful in monitoring aerosol over bright targets where MODIS does not provide retrieval. The biggest disadvantage of MISR over MODIS is its narrow swath width (360km), which make global coverage in every 8-9 days compared to MODIS with global coverage in 1-2 days.

Five Years of MISR Global Aerosol Observations

References:

Kahn, R., B. Gaitley, J. Martonchik, D. Diner, K. Crean, and B. Holben (2005). Multiangle Imaging SpectroRadiometer (MISR) global aerosol optical depth validation based on two years of coincident AERONET observations. J. Geophys. Res. - Atmospheres, doi:jd004706R, 110 (D10): Article No. D10S04 MAR 9 2005. [Abstract] [Full text 680 KB]

Abdou, WA, Diner, DJ, Martonchik, JV Bruegge, CJ, Kahn, RA, Gaitley, BJ, Crean, KA, Remer, LA, Holben, B, (2005). Comparison of coincident Multiangle Imaging Spectroradiometer and Moderate Resolution Imaging Spectroradiometer aerosol optical depths over land and ocean scenes containing Aerosol Robotic Network sites. J. Geophys. Res., Atmos., 110 (D10), D10S07, pp. 11967-76. [
Abstract] [Full text 1584 KB]

Christopher SA, Wang J (2004). Intercomparison between multi-angle imaging spectroradiometer (MISR) and sunphotometer aerosol optical thickness in dust source regions over China: implications for satellite aerosol retrievals and radiative forcing calculations. Tellus Series B-Chemical and Physical Meteorology. 56 (5): 451-456 NOV 2004.[
Abstract]

Martonchik, J. V., D. J. Diner, R. Kahn, B. Gaitley, and B. N. Holben (2004), Comparison of MISR and AERONET aerosol optical depths over desert sites, Geophys. Res. Lett., 31, L16102, doi:10.1029/2004GL019807. [Abstract] [Full text 256 KB]

Zhang, J. and S.A. Christopher (2003). Longwave radiative forcing of Saharan dust aerosols estimated from MODIS, MISR, and CERES observations on Terra. Geophys. Res. Lett. 30, 2188, doi:10.1029/2003GL018479. [Abstract] [Full text 193 KB]
Liu, Y., R. J. Park, D. J. Jacob, Q. Li, V. Kilaru, and J. A. Sarnat (2004), Mapping annual mean ground-level PM2.5 concentrations using Multiangle Imaging Spectroradiometer aerosol optical thickness over the contiguous United States, J. Geophys. Res., 109, D22206, doi:10.1029/2004JD005025. [Abstract] [Full text 596 KB]

Donkelaar, V. A., R. V. Martin, and R. J. Park (2006), Estimating ground-level PM2.5 using aerosol optical depth determined from satellite remote sensing, J. Geophys. Res., 111, D21201, doi:10.1029/2005JD006996.

Sunday, January 28, 2007

Aerosol and Cloud Study using MISR

Multi-angle Imaging SpectroRadiometer (MISR) is an instrument flown aboard terra satellite by NASA on August 1999. As its official web-site truly claims; no instrument like MISR flown before in the space. The unique feature of MISR is its nine cameras looking in nine different directions simultaneously. This affords us to view a given place on the earth from different angles and made it possible to estimate many physical parameters from space.

Concept of the MISR is based on a fact that if directional dependence of the scattered light is studied carefully it can reveal many features about target. Sunlight falling on the earth is not scattered equally in all directions. Halos around the moon in the presence of cirrus clouds is one of such phenomena.

Ability to view a given location from multiple angle has made it possible to observe many physical quantities for atmospheric aerosols and clouds which otherwise were not possible or difficult to observe from space such as single scattering albedo, aerosol optical depth on land, cloud-snow differentiation, etc. Nine cameras are placed symmetric around nadir direction, four looking in forward direction, four in backward direction. Having multiple cameras allow to view a given location multiple times in relatively small interval. Hence tracking a cloud in field of view one can estimate wind velocity at cloud height. Also viewing a given location simultaneously with angular separation allows to obtain depth information. Our own perception of depth is based on angular separation of light beam arriving at our eyes. However this is easy said than done. To derive meaningful quantity from observation, it requires unprecedented level of precision for collocation of images from each camera.

Few of the important data available from MISR web-site are aerosol optical depth on land and ocean, single scattering albedo, angstrom exponent, cloud height, cloud motion, cloud phase, etc. Data are provided free of charge for academic purpose. MISR uses HDF-EOS stack format for level 1 and level 2 data. Level 1 data are georectified radiances and instrument related raw data, whereas level 2 data are georectified physical parameters. Level 3 data are spatially and temporally averaged physical parameters at various resolution.

The swath data i.e. level 1 and level 2 data are projected on Space Oblique Mercator (SOM) map projection. This can be bit weary for the first time user for getting latitude and longitude. One can take advantage of MISR data ordering tool, which allows customization of data, where one can include lat-lon information for every pixels in data file. However, who are comfortable with programming it is pretty straight forward but a word of caution for IDL users. If you are using MAP_PROJ_INIT function then don’t forget to convert inclination from radians to degrees and to include SOM_PERIOD=98.88 in the function.

Saturday, January 20, 2007

Global Warming: Debate Continue

Global climate change is one the area to watch in 2007 as noted by Science magazine in an issue published on December 22, 2006. According to science ‘The case for human-induced warming will grow even more ironclad as the Intergovernmental Panel on Climate Change releases its report in February. Meanwhile, the International Polar Year, opening in March, will feature climate research on Earth's coldest climes. And the world is watching the U.S. Congress, which, under Democratic control, is expected to pass some sort of mandatory emission regime, and President George W. Bush, whose response will be sure to shape the debate’.

But how general public think about global warming? Do they really understand it properly? A survey conducted by David Suzuki Foundation reveals it, ‘Simply put, most people don’t have a clue. The majority felt that global warming was a pretty important problem and they were concerned about it. But when pressed as to why it was a problem or what caused the problem, all heck broke loose. Apparently, according to the average peoples, global warming is happening because we’ve created a hole in the ozone layer, allowing the sun’s rays to enter the atmosphere and heat up the earth — or something like that. The cause of the problem is cars, or airplanes, or aerosol cans. No one really knows for sure.’

Global warming has been an issue of great debate since many decades in the climate science community. Climate scientists around the world report hundreds of research studies, which show over all warming of global earth temperatures. Most of these results are based on global climate models, observational case studies. This group of researchers says ‘Greenhouse gas concentrations in the atmosphere will increase during the next century unless greenhouse gas emissions decrease substantially from present levels. Increased greenhouse gas concentrations are likely to raise the Earth’s average temperature, influence precipitation and some storm patterns as well as raise sea levels. The magnitude of these global warming, however, is uncertain’.


But, this is just one part of the story; there are scientists who do not agree with these researches. One such scientist is Alabama state climatologist, John Christy, who works with the University of Alabama in Huntsville. John Christy and his group use global surface temperature values derived from satellite observations in the micro wave part of solar spectrum, which do not show sufficient warming in the global mean temperature as claimed by other researchers. Recently John posted a letter in Earth & Sky titled ‘The biased notion of catastrophic climate change’. He expressed his feeling by saying ‘After 18 years of collecting, analyzing and publishing global temperature data (which does show some warming, by the way), I have become accustomed to being labeled an outcast and a minority scientist’. He ends the letter with following words ‘Despite assertions and claims made to the contrary, the real science of climate change and global warming is less certain, less reliable and substantially less unanimous than one might think based on news reports, even reports from Earth & Sky, which are, admittedly, less alarmist than the mainstream media’.

After all these discussion, I would say ‘if we put some thing (gases or aerosols) in the atmosphere it will affect the weather and climate and observations show increasing trend in major greenhouse gases (warming effect) and aerosols (both cooling and warming effect) over last century. But in order to quantify these effects and predict the climate change (temperature), our scientific understanding on these complex systems has to be improved.'

Monday, January 15, 2007

Aerosols and green house gases responsible for reduction in rice harvest in India

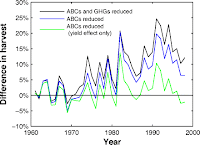
An article by Auffhammer M, Ramanathan V. and Jeffery V in December 26th, 2006 issue of Proceedings of the National Academy of Sciences (PNAS), USA suggests that atmospheric brown cloud (ABC) and green house gases (GHG) are responsible for reduction in rice harvest in India. Atmospheric brown cloud is a term coined by Ramanathan to describe aerosol layer with absorbing nature of particles. Many scientist argue that aerosols are counteracting the warming trend due to green house gases and can be used to mitigate warming trend by putting them in stratosphere. However in case of rice harvest in India both aerosols and GHGs act complementary to each other with net effect of reduction in rice production.

Auffhammer et al., figure 3
Approach taken in this article is different in the sense that it is not about biogeophysical aspect. Rather it is a fusion of economical and general circulation models. Authors have used statistical approach to know how changes in rainfall or extreme temperatures affect area
to be harvested for rice. That is followed by simulations using general circulation model (GCM) to know how rainfall and temperatures going to be changed by ABC and GHG. Using previously derived statistical parameters and GCM results conclusion is drawn that both GHG and ABC negatively impacts the rice production in India.

Article is free to download under open source and can be reached at following link

Auffhammer, M., V. Ramanathan and Vincent J. R. (2006), Integrated model shows that atmospheric brown clouds and greenhouse gases have reduced rice harvests in India, PNAS, 103(52), 19668-19672, doi: 10.1073/pnas.0609584104.


In the same issue of PNAS, a commentary on this article by Cramer is appeared, which can be reached at following link.
Cramer, W. (2006), Air pollutioin and climate change both reduce Indian rice harvests, PNAS, 103(52), 19609-19610, doi: 10.1073/pnas.0610075103.

Image source: Proceedings of the National Academy of Sciences, USA

Monday, January 8, 2007

One of Yoram's last contribution to aerosol science

'Wind reduction by aerosol particles' this is the title of Yoram Kaufman's one of the last published paper appeared in GRL during last month. Yoram was well-known scientist in aerosol community and called as 'father of satellite remote sensing of aerosols'. The present paper discusses the new dimension of aerosol research. Several research studies focusing impact of wind speed on aerosols are published but this is first time Jacobson along with Yoram talks about effects of aerosols on wind speed. Study shows that directly and indirectly aerosol particles can reduce wind speed by 8% locally, which is related to reduction in precipitation. Refer the published article for further findings of the research and detailed methodology used.

Jacobson, M. Z., and Y. J. Kaufman (2006), Wind reduction by aerosol particles, Geophys. Res. Lett., 33, L24814, doi:10.1029/2006GL027838.